
DataNode Storage存储
如果数据节点上的存储容量已满,则会触发此主机级警报。它检查datanode jmx servlet的容量和剩余属性。阈值以百分比为单位。
This host-level alert is triggered if storage capacity if full on the DataNode. It checks the DataNode JMX Servlet for the Capacity and Remaining properties. The threshold values are in percent.
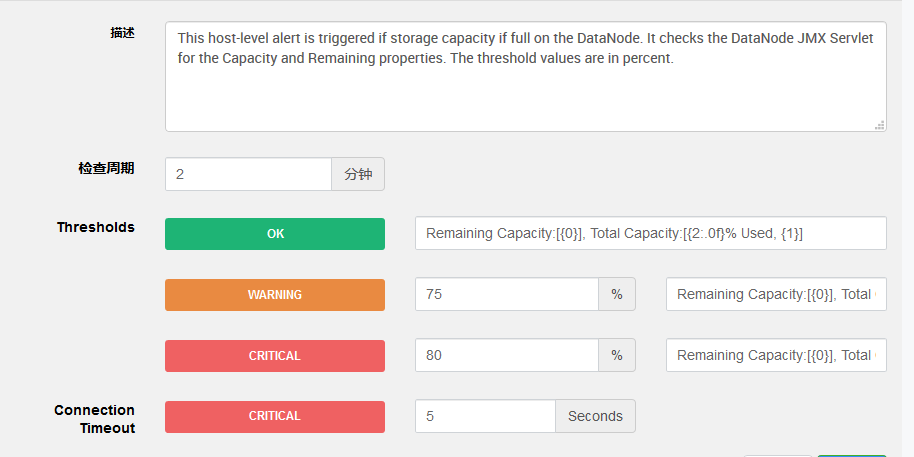
当使用存储达到75%以上,会警告;使用存储达到80%以上严重警告。 从NodeManager获取节点健康状态. 从NodeManager获取节点健康状态.
每1分钟检查一下,超过5分钟没有响应就是严重警告。
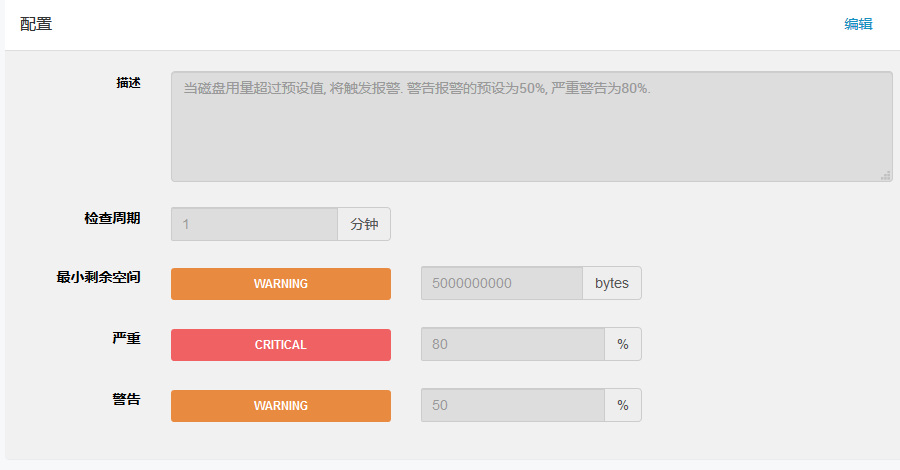
主机磁盘使用率
当磁盘用量超过预设值, 将触发报警. 警告报警的预设为50%, 严重警告为80%.
有可用空间的数据节点百分比
当停止的DataNode 可用存储空间百分比达到阈值时, 触发告警.

存储空间达到10%时,警告;达到30%时,严重警告
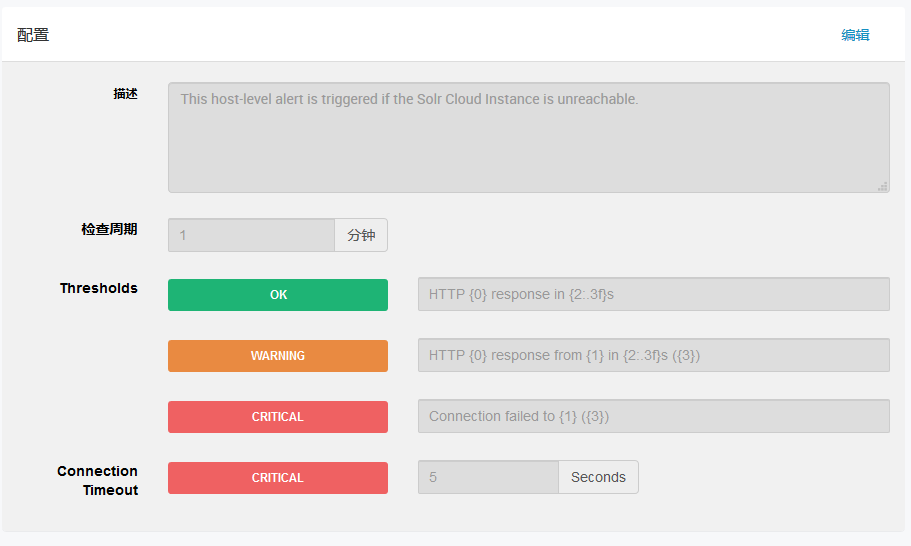
Infra Solr Web用户界面
This host-level alert is triggered if the Solr Cloud Instance is unreachable.
如果无法访问solr云实例,则会触发此主机级警报。
 Kafka Broker Process
描述: "当无法确定Kafka Broker 运行状态时, 将触发告警. 单位:秒."。
Knox Gateway Process
告警名称: "Knox Gateway Process"。描述: "当无法确定Knox Gateway 运行状态时, 将触发告警. 单位:秒."。
Kylin Master Web UI
告警名称: "Kylin Master Web UI"。描述: "如果无法访问Kylin Master Web UI,则会触发此主机级告警。
Kylin QUERY Web UI
告警名称: "Kylin QUERY Web UI"。描述: "如果无法访问Kylin QUERY Web UI,则会触发此主机级告警。"。
Percent RegionServers Available
告警名称: "Percent RegionServers Available"。描述: "当可用的RegionServer 服务百分比达到阈值时, 触发告警. 该结果聚合RegionServer 的所有检测结果."。
HBase Master Process
告警名称: "HBase Master Process"。描述: "当无法确定HBase Master运行状态时, 将触发告警. 单位:秒"。
HBase Master CPU Utilization
告警名称: "HBase Master CPU Utilization"。描述: "当HBase Master CPU 使用率达到阈值时, 触发告警, 通过连接 HBase Master JMX Servlet获取SystemCPULoad 属性. 阈值设定为百分比."。
HBase RegionServer Process
告警名称: "HBase RegionServer Process"。描述: "当无法确定HBase RegionServer 运行状态时, 将触发告警. 单位:秒"。
Percent Metrics Monitors Available
告警名称: "Percent Metrics Monitors Available"。描述: "当可用的Metrics Monitor 服务百分比达到阈值时, 触发告警"。
Metrics Collector - Auto-Restart Status
告警名称: "Metrics Collector - Auto-Restart Status"。描述: "Metrics Collector 在一小时内自动重启的频率过高, 将触发告警. 默认重启 2次(警告), 4次及以上(严重)"。
Metrics Collector Process
告警名称: "Metrics Collector Process"。描述: "当无法确定Metrics Collector运行状态时, 将触发告警. 单位:秒"。
Metrics Collector - HBase Master Process
告警名称: "Metrics Collector - HBase Master Process"。描述: "当无法确定HBase Master运行状态时, 将触发告警. 单位:秒"。
Metrics Collector - HBase Master CPU Utilization
告警名称: "Metrics Collector - HBase Master CPU Utilization"。描述: "当Metrics Collector HBase Master 服务的 CPU 使用率达到阈值时, 触发告警. 通过连接 HBase Master JMX Servlet获取SystemCPULoad 属性. 阈值设定为百分比"。
Metrics Monitor Status
告警名称: "Metrics Monitor Status"。描述: "monitor状态脚本检测的结果"。
Grafana Web UI
告警名称: "Grafana Web UI"。描述: "当无法确定Grafana Web UI运行状态时, 触发告警"。
Percent DataNodes Available
告警名称: "Percent DataNodes Available"。描述: "当停止的DataNode 百分比达到阈值时, 触发告警. 该结果聚合DataNode 的所有检测结果"。
Percent DataNodes With Available Space
告警名称: "Percent DataNodes With Available Space"。描述: "当停止的DataNode 可用存储空间百分比达到阈值时, 触发告警"。
Percent JournalNodes Available
告警名称: "Percent JournalNodes Available"。描述: "当停止的JournalNode 百分比达到阈值时, 触发告警. 该结果聚合JournalNode 的所有检测结果"。
NameNode Web UI
告警名称: "NameNode Web UI"。描述: "当无法确定NameNode Web UI运行状态时, 触发告警"。
HDFS Upgrade Finalized State
告警名称: "HDFS Upgrade Finalized State"。描述: "This service-level alert is triggered if HDFS is not in the finalized state"。
NameNode Host CPU Utilization
告警名称: "NameNode Host CPU Utilization"。描述: "NameNode CPU 使用率达到阈值时, 通过连接 NameNode JMX Servlet获取SystemCPULoad 属性, 触发告警, 阈值设定为百分比."。
NameNode Blocks Health
告警名称: "NameNode Blocks Health"。描述: "当丢失的block数量达到阈值, 触发告警, 单位: block."。
HDFS Pending Deletion Blocks
告警名称: "HDFS Pending Deletion Blocks"。描述: "等待删除的block数量达到阈值, 触发告警. 通过连接 NameNode JMX Servlet 的PendingDeletionBlock 属性获取."。
HDFS Capacity Utilization
告警名称: "HDFS Capacity Utilization"。描述: "当HDFS使用率达到阈值, 触发告警. 通过连接 NameNode JMX Servlet 的 CapacityUsed和CapacityRemaining 属性获取, 阈值设定为百分比."。
NameNode RPC Latency
告警名称: "NameNode RPC Latency"。描述: "当NameNode RPC 延迟达到阈值, 触发告警. 一般增加RPC队列长度时也要调整RPC 延迟时长. 单位: 毫秒(ms)."。
NameNode Directory Status
告警名称: "NameNode Directory Status"。描述: "当NameNode NameDirStatuses 指标 (name=NameNodeInfo/NameDirStatuses)有错误目录时, 触发告警. 阈值为错误目录的数量."。
DataNode Health Summary
告警名称: "DataNode Health Summary"。描述: "当集群中有异常DataNode时, 触发告警"。
NameNode Last Checkpoint
告警名称: "NameNode Last Checkpoint"。描述: "This service-level alert will trigger if the last time that the NameNode performed a checkpoint was too long ago. It will also trigger if the number of uncommitted transactions is beyond a certain threshold."。
NameNode High Availability Health
告警名称: "NameNode High Availability Health"。描述: "This service-level alert is triggered if either the Active NameNode or Standby NameNode are not running."。
NameNode Service RPC Queue Latency (Hourly)
告警名称: "NameNode Service RPC Queue Latency (Hourly)"。描述: "This service-level alert is triggered if the deviation of RPC queue latency on datanode port has grown beyond the specified threshold within an hour period."7.1.36 NameNode Client RPC Queue Latency (Hourly)。
告警名称: "NameNode Client RPC Queue Latency (Hourly)"。描述: "This service-level alert is triggered if the deviation of RPC queue latency on client port has grown beyond the specified threshold within an hour period."。
NameNode Service RPC Processing Latency (Hourly)
告警名称: "NameNode Service RPC Processing Latency (Hourly)"。描述: "This service-level alert is triggered if the deviation of RPC latency on datanode port has grown beyond the specified threshold within an hour period."。
NameNode Client RPC Processing Latency (Hourly)
告警名称: "NameNode Client RPC Processing Latency (Hourly)"。描述: "This service-level alert is triggered if the deviation of RPC latency on client port has grown beyond the specified threshold within an hour period."。
NameNode Heap Usage (Daily)
告警名称: "NameNode Heap Usage (Daily)"。描述: "This service-level alert is triggered if the NameNode heap usage deviation has grown beyond the specified threshold within a day period."。
NameNode Service RPC Processing Latency (Daily)
告警名称: "NameNode Service RPC Processing Latency (Daily)"。描述: "This service-level alert is triggered if the deviation of RPC latency on datanode port has grown beyond the specified threshold within a day period."。
NameNode Client RPC Processing Latency (Daily)
告警名称: "NameNode Client RPC Processing Latency (Daily)"。描述: "This service-level alert is triggered if the deviation of RPC latency on client port has grown beyond the specified threshold within a day period."。
NameNode Service RPC Queue Latency (Daily)
告警名称: "NameNode Service RPC Queue Latency (Daily)"。描述: "This service-level alert is triggered if the deviation of RPC latency on datanode port has grown beyond the specified threshold within a day period."。
NameNode Client RPC Queue Latency (Daily)
告警名称: "NameNode Client RPC Queue Latency (Daily)"。描述: "This service-level alert is triggered if the deviation of RPC latency on client port has grown beyond the specified threshold within a day period."。
HDFS Storage Capacity Usage (Daily)
告警名称: "HDFS Storage Capacity Usage (Daily)"。描述: "This service-level alert is triggered if the increase in storage capacity usage deviation has grown beyond the specified threshold within a day period."。
NameNode Heap Usage (Weekly)
告警名称: "NameNode Heap Usage (Weekly)"。描述: "This service-level alert is triggered if the NameNode heap usage deviation has grown beyond the specified threshold within a week period."。
HDFS Storage Capacity Usage (Weekly)
告警名称: "HDFS Storage Capacity Usage (Weekly)"。描述: "This service-level alert is triggered if the increase in storage capacity usage deviation has grown beyond the specified threshold within a week period."。
Secondary NameNode Process
告警名称: "Secondary NameNode Process"。描述: "This host-level alert is triggered if the Secondary NameNode process cannot be confirmed to be up and listening on the network."。
NFS Gateway Process
告警名称: "NFS Gateway Process"。描述: "This host-level alert is triggered if the NFS Gateway process cannot be confirmed to be up and listening on the network."。
JournalNode Web UI
告警名称: "JournalNode Web UI"。描述: "当无法确定 JournalNode Web UI运行状态时, 触发告警."。
DataNode Process
告警名称: "DataNode Process"。描述: "This host-level alert is triggered if the individual DataNode processes cannot be established to be up and listening on the network."。
DataNode Web UI
告警名称: "DataNode Web UI"。描述: "当无法确定 DataNode Web UI运行状态时, 触发告警."。
DataNode Storage
告警名称: "DataNode Storage"。描述: "This host-level alert is triggered if storage capacity if full on the DataNode. It checks the DataNode JMX Servlet for the Capacity and Remaining properties. The threshold values are in percent."。
DataNode Unmounted Data Dir
告警名称: "DataNode Unmounted Data Dir"。描述: "This host-level alert is triggered if one of the data directories on a host was previously on a mount point and became unmounted. If the mount history file does not exist, then report an error if a host has one or more mounted data directories as well as one or more unmounted data directories on the root partition. This may indicate that a data directory is writing to the root partition, which is undesirable."。
DataNode Heap Usage
告警名称: "DataNode Heap Usage"。描述: "This host-level alert is triggered if heap usage goes past thresholds on the DataNode. It checks the DataNode JMXServlet for the MemHeapUsedM and MemHeapMaxM properties. The threshold values are in percent."。
ZooKeeper Failover Controller Process
告警名称: "ZooKeeper Failover Controller Process"。描述: "当无法确定ZooKeeper Failover Controller运行状态时, 将触发告警. 单位:秒."。
Hive Metastore Process
告警名称: "Hive Metastore Process"。描述: "This host-level alert is triggered if the Hive Metastore process cannot be determined to be up and listening on the network."。
Sys DB status
告警名称: "Sys DB status"。描述: "This alert is triggered if the Sys Db is not created yet."。
HiveServer2 Process
告警名称: "HiveServer2 Process"。描述: "This host-level alert is triggered if the HiveServer cannot be determined to be up and responding to client requests."。
HiveServer2 Interactive Process
告警名称: "HiveServer2 Interactive Process"。描述: "This host-level alert is triggered if the HiveServerInteractive cannot be determined to be up and responding to client requests."。
LLAP Application
告警名称: "LLAP Application"。描述: "This alert is triggered if the LLAP Application cannot be determined to be up and responding to requests."。
Oozie Server Web UI
告警名称: "Oozie Server Web UI"。描述: "无法确定Oozie server Web UI运行状态时, 将触发告警."。
Oozie Server Status
告警名称: "Oozie Server Status"。描述: "无法确定Oozie server 运行状态时, 将触发告警."。
Ranger KMS Server Process
告警名称: "Ranger KMS Server Process"。描述: "当无法确定Ranger KMS Server运行状态时, 将触发告警. 单位:秒."。
Spark2 History Server
告警名称: "Spark2 History Server"。描述: "当无法确定Spark2 History Server运行状态时, 将触发告警. 单位:秒."。
Spark2 Livy Server
告警名称: "Spark2 Livy Server"。描述: "当无法确定Spark2 Livy Server运行状态时, 将触发告警."。
Spark2 Thrift Server
告警名称: "Spark2 Thrift Server"。描述: "当无法确定Spark2 Thrift Server运行状态时, 将触发告警."。
./stacks/HDP/3.0/services/HUE/alerts.json
Hue Web UI
告警名称: "Hue Web UI"。描述: "当无法确定 Hue Web UI运行状态时, 触发告警."。
Solr Web UI
告警名称: "Solr Web UI"。描述: "无法确定Solr Cloud 运行状态时, 将触发告警."。
Solr CPU Utilization
告警名称: "Solr CPU Utilization"。描述: "当CPU使用率达到设定的阈值时, 将触发告警. 通过Solr JMX Servlet 获取SystemCPULoad 属性. 阈值设定为百分比."。
Solr Memory Utilization
告警名称: "Solr Memory Utilization"。描述: "当内存使用率达到设定的阈值时, 将触发告警. 通过Solr JMX Servlet 获取SystemCPULoad 属性. 阈值设定为百分比."。
Druid Coordinator Web UI
告警名称: "Druid Coordinator Web UI"。描述: "当无法确定Druid Coordinator Web UI运行状态时, 将触发告警. 单位:秒."。
Druid Overlord Web UI
告警名称: "Druid Overlord Web UI"。描述: "当无法确定Druid Overlord Web UI运行状态时, 将触发告警. 单位:秒."。
Druid Historical Process
告警名称: "Druid Historical Process"。描述: "当无法确定Druid Historical Process运行状态时, 将触发告警. 单位:秒."。
Druid Broker Process
告警名称: "Druid Broker Process"。描述: "当无法确定Druid Broker Process运行状态时, 将触发告警. 单位:秒."。
Druid Middlemanager Process
告警名称: "Druid Middlemanager Process"。描述: "当无法确定Druid Middlemanager Process运行状态时, 将触发告警. 单位:秒."。
Druid Router Process
告警名称: "Druid Router Process"。描述: "当无法确定Druid Router Process运行状态时, 将触发告警. 单位:秒."。
Ranger Admin Process
告警名称: "Ranger Admin Process", 描述: "无法确定Ranger Admin Web UI运行状态时, 将触发告警.",
Ranger Admin password check
告警名称: "Ranger Admin password check"。描述: "检测Ranger Admin 密码与托管HADOOP中是否一致."。
Ranger Usersync Process
告警名称: "Ranger Usersync Process"。描述: "当无法确定Ranger Usersync运行状态时, 将触发告警. 单位:秒."。
Zeppelin Server Status
告警名称: "Zeppelin Server Status"。描述: "This host-level alert is triggered if the Zeppelin server cannot be determined to be up and responding to client requests."。
Percent ZooKeeper Servers Available
告警名称: "Percent ZooKeeper Servers Available"。描述: "This alert is triggered if the number of down ZooKeeper servers in the cluster is greater than the configured critical threshold. It aggregates the results of ZooKeeper process checks."。
ZooKeeper Server Process
告警名称: "ZooKeeper Server Process"。描述: "This host-level alert is triggered if the ZooKeeper server process cannot be determined to be up and listening on the network."。
ElasticSearch Process Check
告警名称: "ElasticSearch Process Check"。描述: "当无法确定ES Master运行状态时, 将触发告警. 单位:秒"。
History Server Web UI
告警名称: "History Server Web UI"。描述: "当无法确定History Server UI运行状态时, 触发告警."。
History Server CPU 使用率
告警名称: "History Server CPU 使用率"。描述: "当History Server CPU 使用率达到阈值时, 触发告警, 阈值设定为百分比."。
History Server RPC 延迟
告警名称: "History Server RPC 延迟"。描述: "当History Server RPC 延迟达到阈值, 触发告警. 一般增加RPC队列长度时也要调整RPC 延迟时长. 单位: 毫秒(ms)."。
Percent NodeManagers Available
告警名称: "Percent NodeManagers Available"。描述: "当停止的NodeManager 百分比达到阈值时, 触发告警. 该结果聚合NodeManager 的所有检测结果."。
NodeManager Web UI
告警名称: "NodeManager Web UI"。描述: "当无法确定NodeManager Web UI运行状态时, 触发告警."。
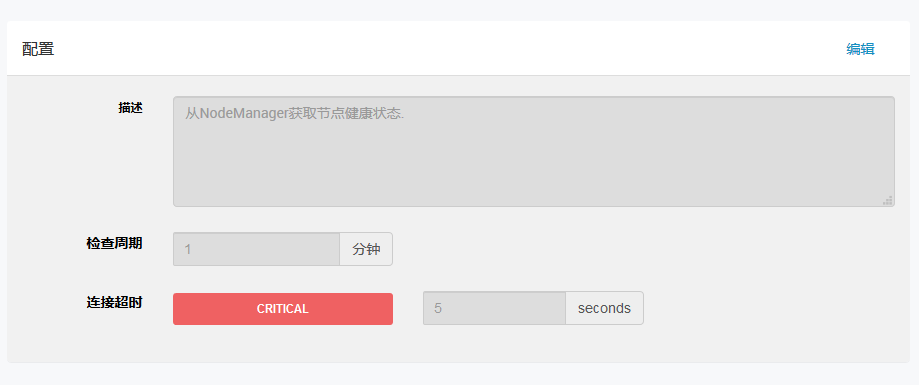
NodeManager Health
告警名称: "NodeManager Health"。描述: "从NodeManager获取节点健康状态."。
ResourceManager Web UI
告警名称: "ResourceManager Web UI"。描述: "当无法确定ResourceManager Web UI运行状态时, 触发告警."。
ResourceManager CPU 使用率
告警名称: "ResourceManager CPU 使用率"。描述: "ResourceManager CPU 使用率达到阈值时, 通过连接 ResourceManager JMX Servlet获取SystemCPULoad 属性, 触发告警, 阈值设定为百分比."。
ResourceManager RPC 延迟
告警名称: "ResourceManager RPC 延迟"。描述: "当ResourceManager RPC 延迟达到阈值, 触发告警. 一般增加RPC队列长度时也要调整RPC 延迟时长. 单位: 毫秒(ms)."。
NodeManager Health Summary
告警名称: "NodeManager Health Summary"。描述: "当集群中有不正常的 NodeManager时, 触发告警"。
App Timeline Web UI
告警名称: "App Timeline Web UI"。描述: "当无法确定App Timeline Web UI运行状态时, 触发告警."。
Registry DNS
告警名称: "Registry DNS"。描述: "当无法确定Registry DNS运行状态时, 将触发告警. 单位:秒."。
Metadata Server Web UI
告警名称: "Metadata Server Web UI"。描述: "当无法确定 Metadata Server Web UI运行状态时, 触发告警."。
Superset Web UI
告警名称: "Superset Web UI"。描述: "当无法确定Superset Web UI运行状态时, 触发告警."。
Accumulo Master Process
告警名称: "Accumulo Master Process"。描述: "当无法确定Accumulo Master运行状态时, 将触发告警. 单位:秒."。
Accumulo TServer Process
告警名称: "Accumulo TServer Process"。描述: "当无法确定Accumulo TServer运行状态时, 将触发告警. 单位:秒."。
Accumulo GC Process
告警名称: "Accumulo GC Process"。描述: "当无法确定Accumulo GC运行状态时, 将触发告警. 单位:秒."。
Accumulo Monitor Process
告警名称: "Accumulo Monitor Process"。描述: "当无法确定Accumulo Monitor运行状态时, 将触发告警. 单位:秒."。
Kafka Broker Process
描述: "当无法确定Kafka Broker 运行状态时, 将触发告警. 单位:秒."。
Knox Gateway Process
告警名称: "Knox Gateway Process"。描述: "当无法确定Knox Gateway 运行状态时, 将触发告警. 单位:秒."。
Kylin Master Web UI
告警名称: "Kylin Master Web UI"。描述: "如果无法访问Kylin Master Web UI,则会触发此主机级告警。
Kylin QUERY Web UI
告警名称: "Kylin QUERY Web UI"。描述: "如果无法访问Kylin QUERY Web UI,则会触发此主机级告警。"。
Percent RegionServers Available
告警名称: "Percent RegionServers Available"。描述: "当可用的RegionServer 服务百分比达到阈值时, 触发告警. 该结果聚合RegionServer 的所有检测结果."。
HBase Master Process
告警名称: "HBase Master Process"。描述: "当无法确定HBase Master运行状态时, 将触发告警. 单位:秒"。
HBase Master CPU Utilization
告警名称: "HBase Master CPU Utilization"。描述: "当HBase Master CPU 使用率达到阈值时, 触发告警, 通过连接 HBase Master JMX Servlet获取SystemCPULoad 属性. 阈值设定为百分比."。
HBase RegionServer Process
告警名称: "HBase RegionServer Process"。描述: "当无法确定HBase RegionServer 运行状态时, 将触发告警. 单位:秒"。
Percent Metrics Monitors Available
告警名称: "Percent Metrics Monitors Available"。描述: "当可用的Metrics Monitor 服务百分比达到阈值时, 触发告警"。
Metrics Collector - Auto-Restart Status
告警名称: "Metrics Collector - Auto-Restart Status"。描述: "Metrics Collector 在一小时内自动重启的频率过高, 将触发告警. 默认重启 2次(警告), 4次及以上(严重)"。
Metrics Collector Process
告警名称: "Metrics Collector Process"。描述: "当无法确定Metrics Collector运行状态时, 将触发告警. 单位:秒"。
Metrics Collector - HBase Master Process
告警名称: "Metrics Collector - HBase Master Process"。描述: "当无法确定HBase Master运行状态时, 将触发告警. 单位:秒"。
Metrics Collector - HBase Master CPU Utilization
告警名称: "Metrics Collector - HBase Master CPU Utilization"。描述: "当Metrics Collector HBase Master 服务的 CPU 使用率达到阈值时, 触发告警. 通过连接 HBase Master JMX Servlet获取SystemCPULoad 属性. 阈值设定为百分比"。
Metrics Monitor Status
告警名称: "Metrics Monitor Status"。描述: "monitor状态脚本检测的结果"。
Grafana Web UI
告警名称: "Grafana Web UI"。描述: "当无法确定Grafana Web UI运行状态时, 触发告警"。
Percent DataNodes Available
告警名称: "Percent DataNodes Available"。描述: "当停止的DataNode 百分比达到阈值时, 触发告警. 该结果聚合DataNode 的所有检测结果"。
Percent DataNodes With Available Space
告警名称: "Percent DataNodes With Available Space"。描述: "当停止的DataNode 可用存储空间百分比达到阈值时, 触发告警"。
Percent JournalNodes Available
告警名称: "Percent JournalNodes Available"。描述: "当停止的JournalNode 百分比达到阈值时, 触发告警. 该结果聚合JournalNode 的所有检测结果"。
NameNode Web UI
告警名称: "NameNode Web UI"。描述: "当无法确定NameNode Web UI运行状态时, 触发告警"。
HDFS Upgrade Finalized State
告警名称: "HDFS Upgrade Finalized State"。描述: "This service-level alert is triggered if HDFS is not in the finalized state"。
NameNode Host CPU Utilization
告警名称: "NameNode Host CPU Utilization"。描述: "NameNode CPU 使用率达到阈值时, 通过连接 NameNode JMX Servlet获取SystemCPULoad 属性, 触发告警, 阈值设定为百分比."。
NameNode Blocks Health
告警名称: "NameNode Blocks Health"。描述: "当丢失的block数量达到阈值, 触发告警, 单位: block."。
HDFS Pending Deletion Blocks
告警名称: "HDFS Pending Deletion Blocks"。描述: "等待删除的block数量达到阈值, 触发告警. 通过连接 NameNode JMX Servlet 的PendingDeletionBlock 属性获取."。
HDFS Capacity Utilization
告警名称: "HDFS Capacity Utilization"。描述: "当HDFS使用率达到阈值, 触发告警. 通过连接 NameNode JMX Servlet 的 CapacityUsed和CapacityRemaining 属性获取, 阈值设定为百分比."。
NameNode RPC Latency
告警名称: "NameNode RPC Latency"。描述: "当NameNode RPC 延迟达到阈值, 触发告警. 一般增加RPC队列长度时也要调整RPC 延迟时长. 单位: 毫秒(ms)."。
NameNode Directory Status
告警名称: "NameNode Directory Status"。描述: "当NameNode NameDirStatuses 指标 (name=NameNodeInfo/NameDirStatuses)有错误目录时, 触发告警. 阈值为错误目录的数量."。
DataNode Health Summary
告警名称: "DataNode Health Summary"。描述: "当集群中有异常DataNode时, 触发告警"。
NameNode Last Checkpoint
告警名称: "NameNode Last Checkpoint"。描述: "This service-level alert will trigger if the last time that the NameNode performed a checkpoint was too long ago. It will also trigger if the number of uncommitted transactions is beyond a certain threshold."。
NameNode High Availability Health
告警名称: "NameNode High Availability Health"。描述: "This service-level alert is triggered if either the Active NameNode or Standby NameNode are not running."。
NameNode Service RPC Queue Latency (Hourly)
告警名称: "NameNode Service RPC Queue Latency (Hourly)"。描述: "This service-level alert is triggered if the deviation of RPC queue latency on datanode port has grown beyond the specified threshold within an hour period."7.1.36 NameNode Client RPC Queue Latency (Hourly)。
告警名称: "NameNode Client RPC Queue Latency (Hourly)"。描述: "This service-level alert is triggered if the deviation of RPC queue latency on client port has grown beyond the specified threshold within an hour period."。
NameNode Service RPC Processing Latency (Hourly)
告警名称: "NameNode Service RPC Processing Latency (Hourly)"。描述: "This service-level alert is triggered if the deviation of RPC latency on datanode port has grown beyond the specified threshold within an hour period."。
NameNode Client RPC Processing Latency (Hourly)
告警名称: "NameNode Client RPC Processing Latency (Hourly)"。描述: "This service-level alert is triggered if the deviation of RPC latency on client port has grown beyond the specified threshold within an hour period."。
NameNode Heap Usage (Daily)
告警名称: "NameNode Heap Usage (Daily)"。描述: "This service-level alert is triggered if the NameNode heap usage deviation has grown beyond the specified threshold within a day period."。
NameNode Service RPC Processing Latency (Daily)
告警名称: "NameNode Service RPC Processing Latency (Daily)"。描述: "This service-level alert is triggered if the deviation of RPC latency on datanode port has grown beyond the specified threshold within a day period."。
NameNode Client RPC Processing Latency (Daily)
告警名称: "NameNode Client RPC Processing Latency (Daily)"。描述: "This service-level alert is triggered if the deviation of RPC latency on client port has grown beyond the specified threshold within a day period."。
NameNode Service RPC Queue Latency (Daily)
告警名称: "NameNode Service RPC Queue Latency (Daily)"。描述: "This service-level alert is triggered if the deviation of RPC latency on datanode port has grown beyond the specified threshold within a day period."。
NameNode Client RPC Queue Latency (Daily)
告警名称: "NameNode Client RPC Queue Latency (Daily)"。描述: "This service-level alert is triggered if the deviation of RPC latency on client port has grown beyond the specified threshold within a day period."。
HDFS Storage Capacity Usage (Daily)
告警名称: "HDFS Storage Capacity Usage (Daily)"。描述: "This service-level alert is triggered if the increase in storage capacity usage deviation has grown beyond the specified threshold within a day period."。
NameNode Heap Usage (Weekly)
告警名称: "NameNode Heap Usage (Weekly)"。描述: "This service-level alert is triggered if the NameNode heap usage deviation has grown beyond the specified threshold within a week period."。
HDFS Storage Capacity Usage (Weekly)
告警名称: "HDFS Storage Capacity Usage (Weekly)"。描述: "This service-level alert is triggered if the increase in storage capacity usage deviation has grown beyond the specified threshold within a week period."。
Secondary NameNode Process
告警名称: "Secondary NameNode Process"。描述: "This host-level alert is triggered if the Secondary NameNode process cannot be confirmed to be up and listening on the network."。
NFS Gateway Process
告警名称: "NFS Gateway Process"。描述: "This host-level alert is triggered if the NFS Gateway process cannot be confirmed to be up and listening on the network."。
JournalNode Web UI
告警名称: "JournalNode Web UI"。描述: "当无法确定 JournalNode Web UI运行状态时, 触发告警."。
DataNode Process
告警名称: "DataNode Process"。描述: "This host-level alert is triggered if the individual DataNode processes cannot be established to be up and listening on the network."。
DataNode Web UI
告警名称: "DataNode Web UI"。描述: "当无法确定 DataNode Web UI运行状态时, 触发告警."。
DataNode Storage
告警名称: "DataNode Storage"。描述: "This host-level alert is triggered if storage capacity if full on the DataNode. It checks the DataNode JMX Servlet for the Capacity and Remaining properties. The threshold values are in percent."。
DataNode Unmounted Data Dir
告警名称: "DataNode Unmounted Data Dir"。描述: "This host-level alert is triggered if one of the data directories on a host was previously on a mount point and became unmounted. If the mount history file does not exist, then report an error if a host has one or more mounted data directories as well as one or more unmounted data directories on the root partition. This may indicate that a data directory is writing to the root partition, which is undesirable."。
DataNode Heap Usage
告警名称: "DataNode Heap Usage"。描述: "This host-level alert is triggered if heap usage goes past thresholds on the DataNode. It checks the DataNode JMXServlet for the MemHeapUsedM and MemHeapMaxM properties. The threshold values are in percent."。
ZooKeeper Failover Controller Process
告警名称: "ZooKeeper Failover Controller Process"。描述: "当无法确定ZooKeeper Failover Controller运行状态时, 将触发告警. 单位:秒."。
Hive Metastore Process
告警名称: "Hive Metastore Process"。描述: "This host-level alert is triggered if the Hive Metastore process cannot be determined to be up and listening on the network."。
Sys DB status
告警名称: "Sys DB status"。描述: "This alert is triggered if the Sys Db is not created yet."。
HiveServer2 Process
告警名称: "HiveServer2 Process"。描述: "This host-level alert is triggered if the HiveServer cannot be determined to be up and responding to client requests."。
HiveServer2 Interactive Process
告警名称: "HiveServer2 Interactive Process"。描述: "This host-level alert is triggered if the HiveServerInteractive cannot be determined to be up and responding to client requests."。
LLAP Application
告警名称: "LLAP Application"。描述: "This alert is triggered if the LLAP Application cannot be determined to be up and responding to requests."。
Oozie Server Web UI
告警名称: "Oozie Server Web UI"。描述: "无法确定Oozie server Web UI运行状态时, 将触发告警."。
Oozie Server Status
告警名称: "Oozie Server Status"。描述: "无法确定Oozie server 运行状态时, 将触发告警."。
Ranger KMS Server Process
告警名称: "Ranger KMS Server Process"。描述: "当无法确定Ranger KMS Server运行状态时, 将触发告警. 单位:秒."。
Spark2 History Server
告警名称: "Spark2 History Server"。描述: "当无法确定Spark2 History Server运行状态时, 将触发告警. 单位:秒."。
Spark2 Livy Server
告警名称: "Spark2 Livy Server"。描述: "当无法确定Spark2 Livy Server运行状态时, 将触发告警."。
Spark2 Thrift Server
告警名称: "Spark2 Thrift Server"。描述: "当无法确定Spark2 Thrift Server运行状态时, 将触发告警."。
./stacks/HDP/3.0/services/HUE/alerts.json
Hue Web UI
告警名称: "Hue Web UI"。描述: "当无法确定 Hue Web UI运行状态时, 触发告警."。
Solr Web UI
告警名称: "Solr Web UI"。描述: "无法确定Solr Cloud 运行状态时, 将触发告警."。
Solr CPU Utilization
告警名称: "Solr CPU Utilization"。描述: "当CPU使用率达到设定的阈值时, 将触发告警. 通过Solr JMX Servlet 获取SystemCPULoad 属性. 阈值设定为百分比."。
Solr Memory Utilization
告警名称: "Solr Memory Utilization"。描述: "当内存使用率达到设定的阈值时, 将触发告警. 通过Solr JMX Servlet 获取SystemCPULoad 属性. 阈值设定为百分比."。
Druid Coordinator Web UI
告警名称: "Druid Coordinator Web UI"。描述: "当无法确定Druid Coordinator Web UI运行状态时, 将触发告警. 单位:秒."。
Druid Overlord Web UI
告警名称: "Druid Overlord Web UI"。描述: "当无法确定Druid Overlord Web UI运行状态时, 将触发告警. 单位:秒."。
Druid Historical Process
告警名称: "Druid Historical Process"。描述: "当无法确定Druid Historical Process运行状态时, 将触发告警. 单位:秒."。
Druid Broker Process
告警名称: "Druid Broker Process"。描述: "当无法确定Druid Broker Process运行状态时, 将触发告警. 单位:秒."。
Druid Middlemanager Process
告警名称: "Druid Middlemanager Process"。描述: "当无法确定Druid Middlemanager Process运行状态时, 将触发告警. 单位:秒."。
Druid Router Process
告警名称: "Druid Router Process"。描述: "当无法确定Druid Router Process运行状态时, 将触发告警. 单位:秒."。
Ranger Admin Process
告警名称: "Ranger Admin Process", 描述: "无法确定Ranger Admin Web UI运行状态时, 将触发告警.",
Ranger Admin password check
告警名称: "Ranger Admin password check"。描述: "检测Ranger Admin 密码与托管HADOOP中是否一致."。
Ranger Usersync Process
告警名称: "Ranger Usersync Process"。描述: "当无法确定Ranger Usersync运行状态时, 将触发告警. 单位:秒."。
Zeppelin Server Status
告警名称: "Zeppelin Server Status"。描述: "This host-level alert is triggered if the Zeppelin server cannot be determined to be up and responding to client requests."。
Percent ZooKeeper Servers Available
告警名称: "Percent ZooKeeper Servers Available"。描述: "This alert is triggered if the number of down ZooKeeper servers in the cluster is greater than the configured critical threshold. It aggregates the results of ZooKeeper process checks."。
ZooKeeper Server Process
告警名称: "ZooKeeper Server Process"。描述: "This host-level alert is triggered if the ZooKeeper server process cannot be determined to be up and listening on the network."。
ElasticSearch Process Check
告警名称: "ElasticSearch Process Check"。描述: "当无法确定ES Master运行状态时, 将触发告警. 单位:秒"。
History Server Web UI
告警名称: "History Server Web UI"。描述: "当无法确定History Server UI运行状态时, 触发告警."。
History Server CPU 使用率
告警名称: "History Server CPU 使用率"。描述: "当History Server CPU 使用率达到阈值时, 触发告警, 阈值设定为百分比."。
History Server RPC 延迟
告警名称: "History Server RPC 延迟"。描述: "当History Server RPC 延迟达到阈值, 触发告警. 一般增加RPC队列长度时也要调整RPC 延迟时长. 单位: 毫秒(ms)."。
Percent NodeManagers Available
告警名称: "Percent NodeManagers Available"。描述: "当停止的NodeManager 百分比达到阈值时, 触发告警. 该结果聚合NodeManager 的所有检测结果."。
NodeManager Web UI
告警名称: "NodeManager Web UI"。描述: "当无法确定NodeManager Web UI运行状态时, 触发告警."。
NodeManager Health
告警名称: "NodeManager Health"。描述: "从NodeManager获取节点健康状态."。
ResourceManager Web UI
告警名称: "ResourceManager Web UI"。描述: "当无法确定ResourceManager Web UI运行状态时, 触发告警."。
ResourceManager CPU 使用率
告警名称: "ResourceManager CPU 使用率"。描述: "ResourceManager CPU 使用率达到阈值时, 通过连接 ResourceManager JMX Servlet获取SystemCPULoad 属性, 触发告警, 阈值设定为百分比."。
ResourceManager RPC 延迟
告警名称: "ResourceManager RPC 延迟"。描述: "当ResourceManager RPC 延迟达到阈值, 触发告警. 一般增加RPC队列长度时也要调整RPC 延迟时长. 单位: 毫秒(ms)."。
NodeManager Health Summary
告警名称: "NodeManager Health Summary"。描述: "当集群中有不正常的 NodeManager时, 触发告警"。
App Timeline Web UI
告警名称: "App Timeline Web UI"。描述: "当无法确定App Timeline Web UI运行状态时, 触发告警."。
Registry DNS
告警名称: "Registry DNS"。描述: "当无法确定Registry DNS运行状态时, 将触发告警. 单位:秒."。
Metadata Server Web UI
告警名称: "Metadata Server Web UI"。描述: "当无法确定 Metadata Server Web UI运行状态时, 触发告警."。
Superset Web UI
告警名称: "Superset Web UI"。描述: "当无法确定Superset Web UI运行状态时, 触发告警."。
Accumulo Master Process
告警名称: "Accumulo Master Process"。描述: "当无法确定Accumulo Master运行状态时, 将触发告警. 单位:秒."。
Accumulo TServer Process
告警名称: "Accumulo TServer Process"。描述: "当无法确定Accumulo TServer运行状态时, 将触发告警. 单位:秒."。
Accumulo GC Process
告警名称: "Accumulo GC Process"。描述: "当无法确定Accumulo GC运行状态时, 将触发告警. 单位:秒."。
Accumulo Monitor Process
告警名称: "Accumulo Monitor Process"。描述: "当无法确定Accumulo Monitor运行状态时, 将触发告警. 单位:秒."。